Sravanthi Mopati

Understanding Drone Orthomosaics

Orthomosaics are individual images stitched into one single high-resolution image. In our case, these are taken from the drone and so they are georeferenced and can give a resolution of upto a few cm per pixel. This is drastically finer than freely available satellite data and so drone based orthomosaics are being used extensively for all types of landscape assessment.

Collecting data for an orthomosaic:

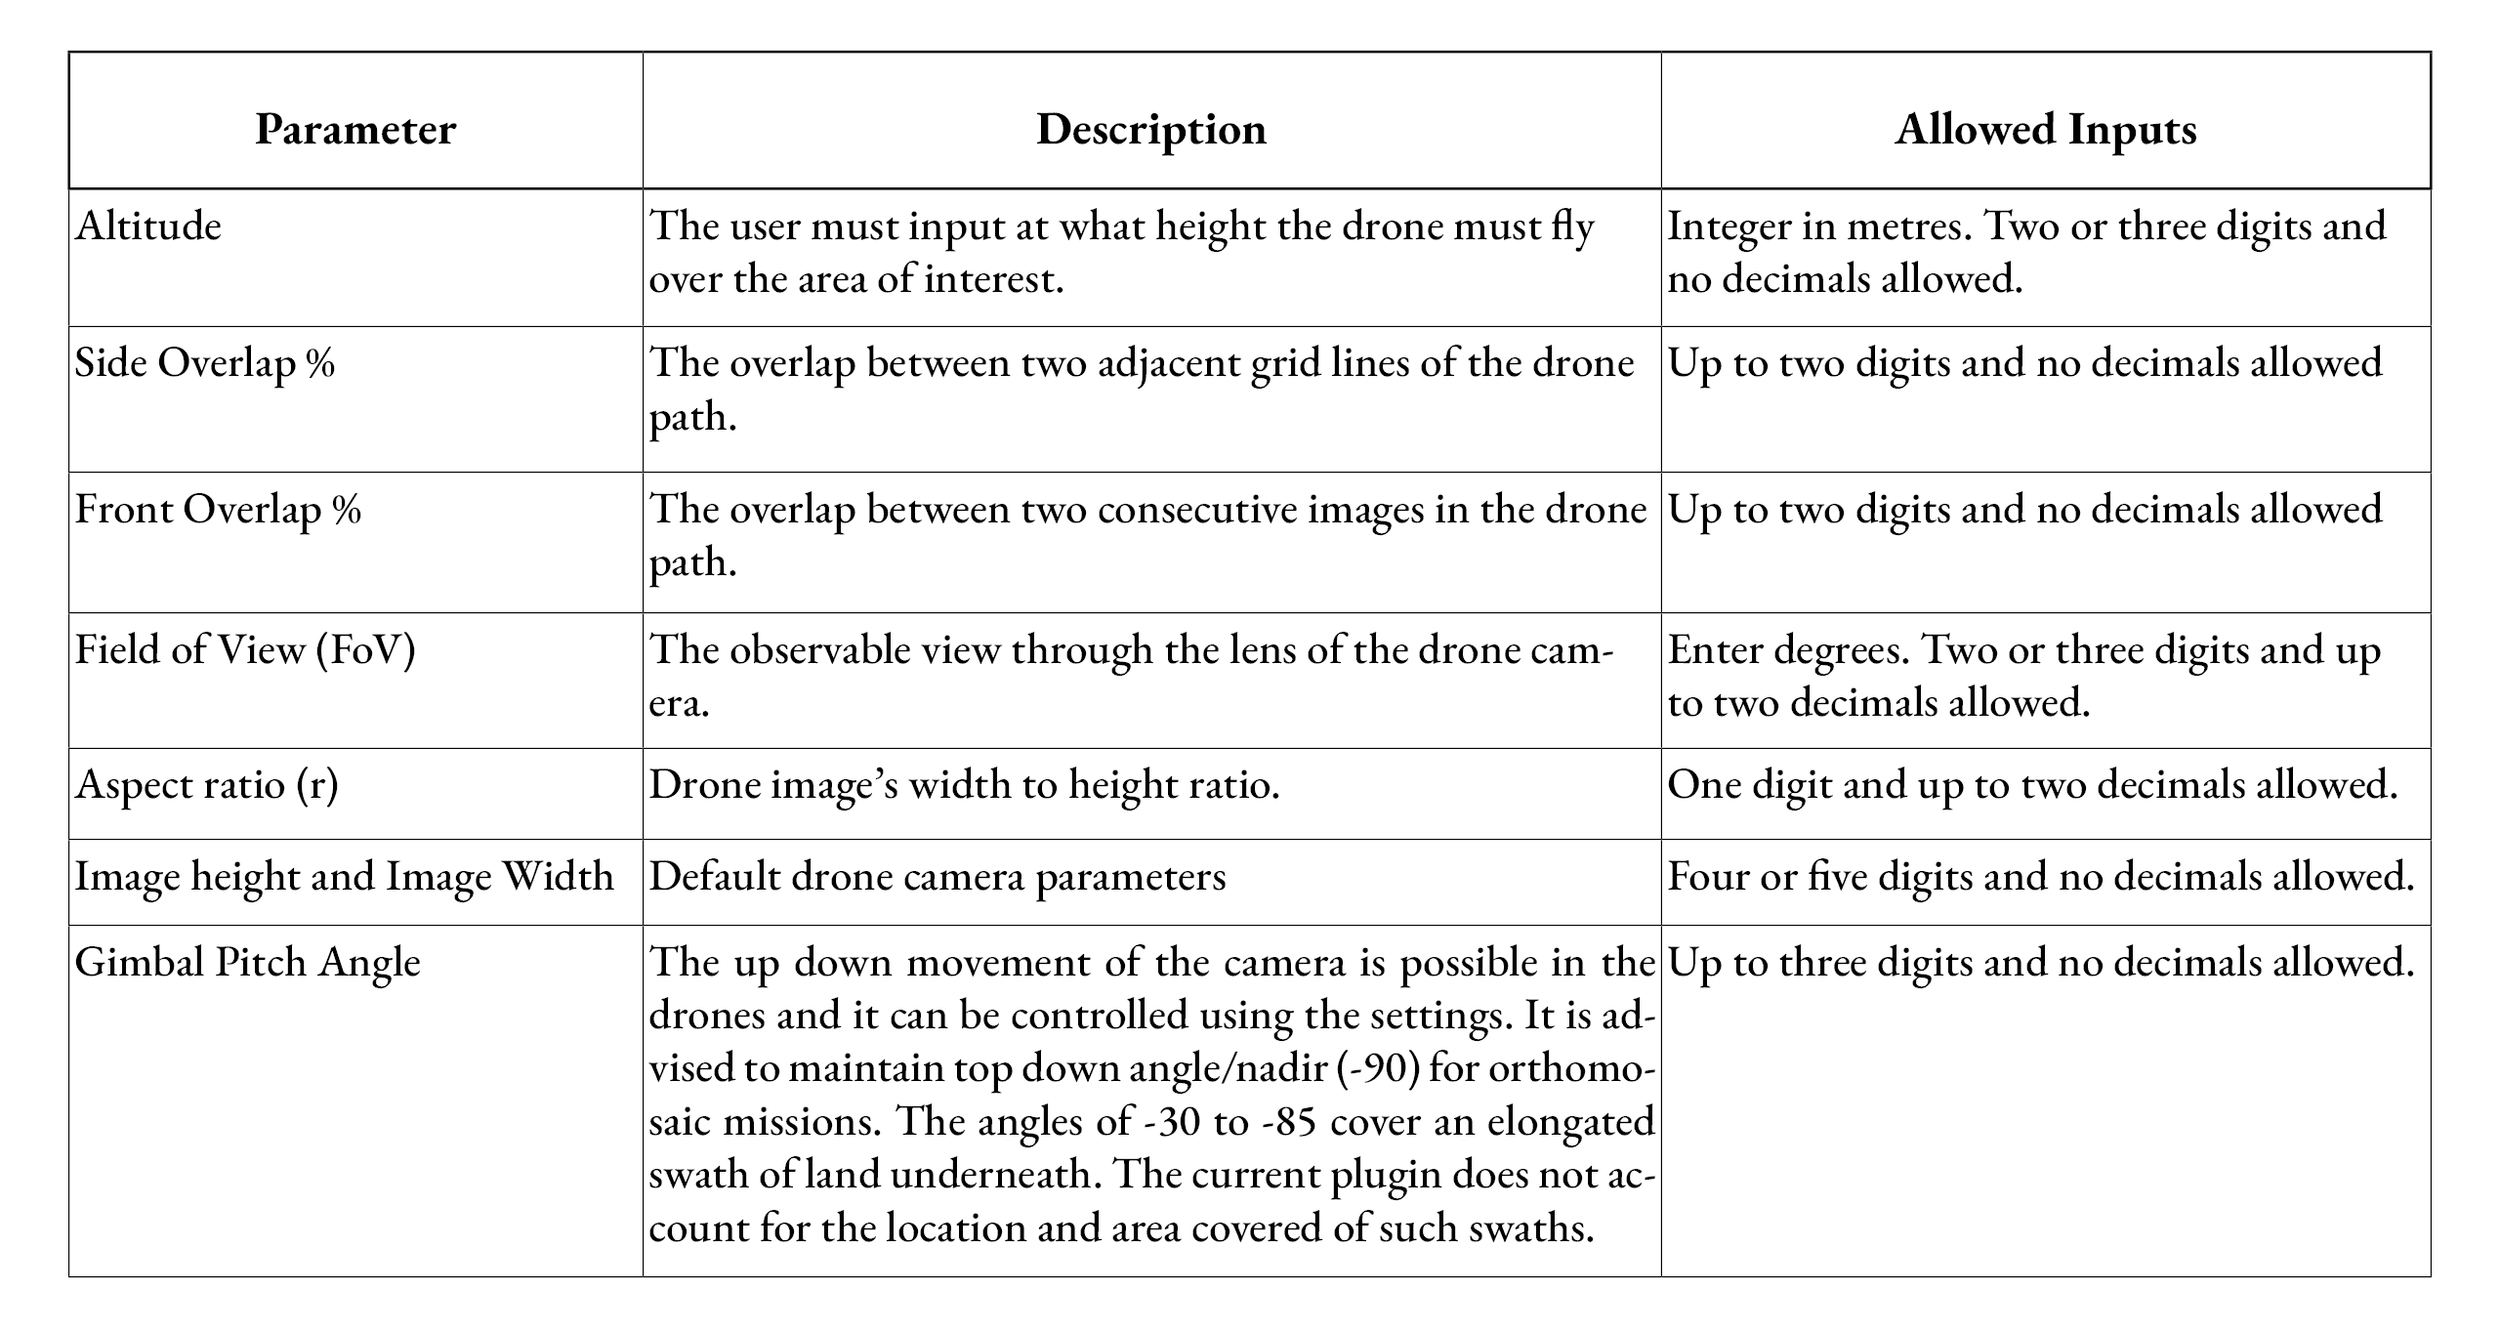
To create a drone-based orthomosaic, one has to plan an appropriate flight mission. However, some important factors to keep in mind when planning a mapping mission are -

  • The flight needs to form a grid, with the drone moving at a constant height and gimble pitching straight down at 90 degrees. 

  • Maintain a minimum of 70% to 80% front and side overlap of images captured while planning the flight.

  • Collect Ground Control Points from the Area Of Interest to improve the accuracy of georeferencing of the orthomosaic.

  • Maintain a moderately slow speed for the drone to move between images so as to reduce distortion.

  • Use mechanical or global shutter, if available, to capture images from drone cameras.

More details of this can be found on our blog on creating mapping missions.

Processing drone data to create an orthomosaic:

Once the drone images are collected, they need to be stitched together to create this high-resolution, georeferenced orthomosaic. At TfW, we used WebODM for this purpose. 

WebODM is a user-friendly drone image processing software. It is a web interface of OpenDroneMap (ODM), which is an open source command line toolkit for processing drone images to create maps, point clouds, 3D models and other geospatial products. There are two versions of this software: WebODM and WebODM Lightning. 

The offline version of  WebODM can be installed manually for free using this link. Command line skills are required to install this version. The installer version of offline webODM is also available here for a one time purchase. The offline version uses the local machine for processing and storing data.

Note: The WebODM Lightning option is a cloud hosted version of WebODM with some additional functionalities. This version is subscription based with standard and business categories. The trial version comes with 150 credits of free usage. The free credits suffice to process 337 images. The number of tasks allowed in free trial is not clear from the documentation. Paid plans will be required to process more images.

Once you have the images from the mapping mission - you can import them into the web ODM by selecting the ‘Select Images and GCP’ option. 

Fig. 01: Select images and Edit options

While selecting the images, exclude the outliers. For instance, images of the horizon or randomly clicked images which may be errors and should not be included in the orthomosaic. 

After selecting the images, one can edit the settings of the processing workflow by clicking on the Edit option (Fig 01). The functionalities of all the customizable options available in ‘Edit’ are explained elaborately here.

Some default options are as listed in (Fig 02). The default options work for most cases and the best way to assess edit options is to run them on a test dataset. 

Fig. 02: Customised Edit Options

Pro Tip: The High Resolution option with the original image size option takes more than an hour to process 200 images. The fast orthophoto option is quicker but the orthomosaic will have some distortions as displayed here. The guidelines to optimize flight plans according to the landscape are listed here

Analyzing orthomosaics:

This orthomosaic can now be analysed as a .tif file in GIS softwares. In this section, we explore how to use QGIS for this purpose.

Install a stable QGIS version from Download QGIS. It is advisable to install the most stable updated version than the latest version. 

Import the tif into QGIS: Once you download all the assets from webODM task, navigate to the folder where you have saved the outputs. The users are encouraged to explore the downloaded folders to gain information on the flight plan logistics. Among the downloaded files and folders, you can navigate to the odm_orthophoto folder and import the odm_orthophoto.tif file into QGIS map view.

Fig. 03: Download the assets.

Creating indexed images from satellite and aerial image bands is an effective way to extract information from the images. A list of few insightful indices are listed in this blog. In this instance, we will use the Green Leaf Index to get a visual estimate of the greenness of the area.

To begin, once you have imported the tif file into QGIS, select the ‘Raster Calculator’ from the Raster menu.

Fig. 04: Select raster calculator option.

Select the bands and calculate the Green Leaf Index using the raster calculator:

Green/ (Green + Red + Blue)

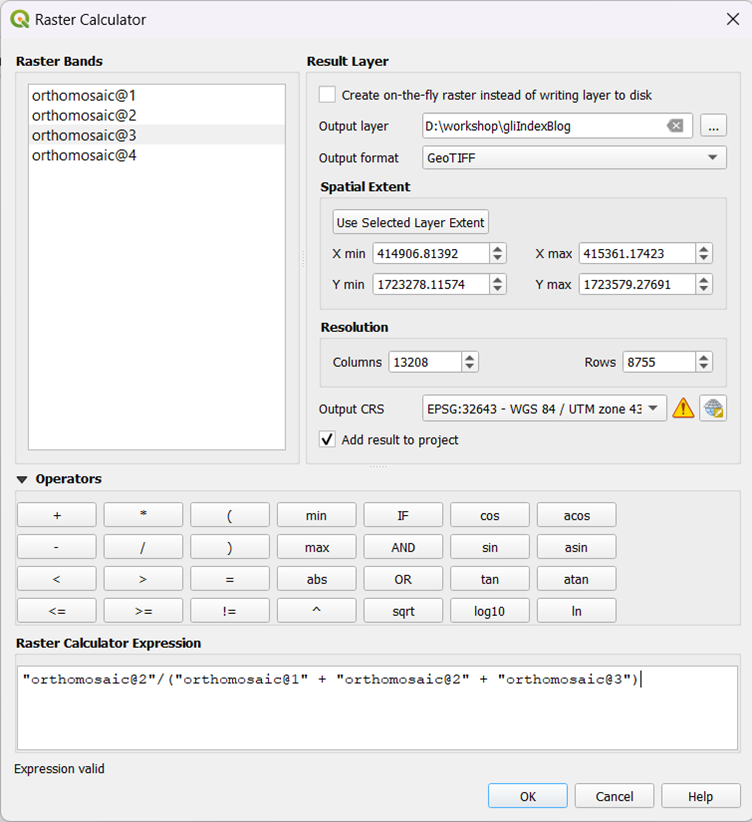
Fig. 05: Raster Calculator. 

Once you have the indexed output, select appropriate symbology to view the indexed image. Right click on the layer and select ‘Properties’ or double click on the image. Navigate to Symbology option. 

Fig. 06: Symbology of layer.

Select the appropriate settings for colour ramp and apply it to the indexed image. 

Fig. 07: Image with selected symbology.

We see that the above image is not giving us a contrast in the image to estimate vegetation health. In this case, one can explore the blending option. This may be useful to get an immediate idea of the area at a glance.

Fig. 08: Blending options for better visual assessment.

In order to extract contrasting information from the orthomosaic and indexed image, we can check the histogram of the indexed image and then decide the minimum and maximum values based on the distribution of the image.

Fig. 09: Histogram analysis for optimising visual output.

Looking at the histogram we can tell that the range of information is encoded between 0.3 to 0.6 pixel value range. Now go back to the symbology and change the minimum and maximum values to that range. 

Fig. 10: Image after rectifying minimum and maximum value range.

From the indexed image, we see that the western part of the image has lower leaf area as compared to the other parts. In order to focus on that area, create a polygon over it and draw a grid.

Fig. 11: Create a polygon layer.

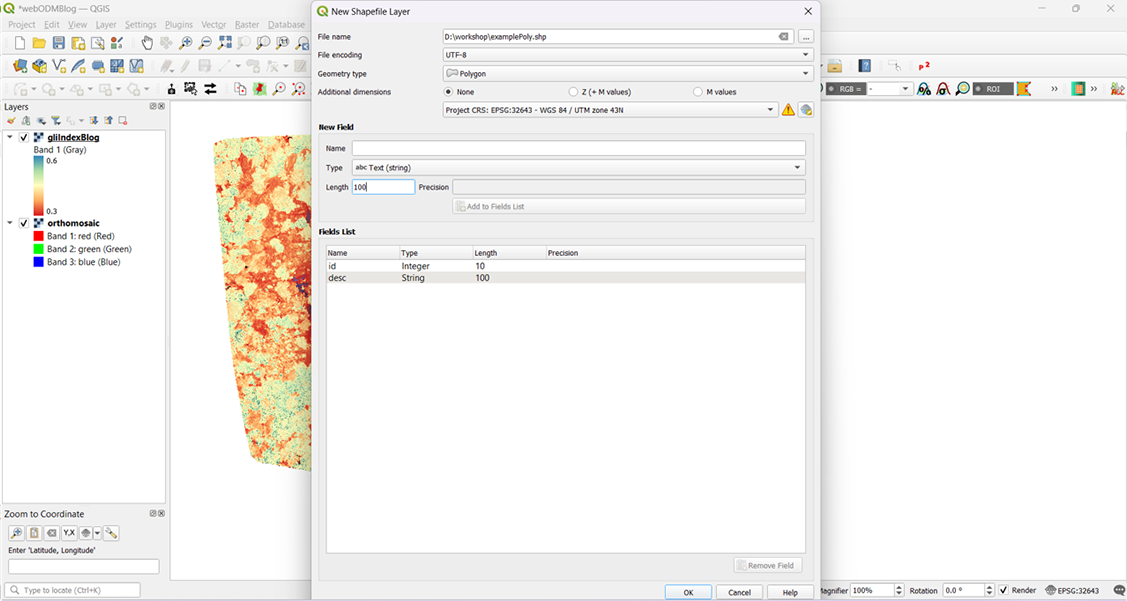
Fig. 12: Select options to create a polygon.

You must digitise a polygon in projected CRS. Projected CRS is necessary for making measurements on the shapefile.

Fig. 13: Digitise and save the polygon.

To calculate the area of the polygon, right click the polygon layer and open the attribute layer.

Fig. 14: Open attribute table.

Open the field calculator and select the option shown in the following image to calculate the area of the polygon.

Fig. 15: Select ‘area’ field from Geometry.

Fig. 16: Area field added to the polygon.

The area field is automatically calculated and added to the attribute table. It is recommended that the polygon layer has a projected CRS for this calculation to be correct. Then save edits and untoggle the editing.

You can also create a grid of squares in the polygon using the create grid tool under the vector menu.

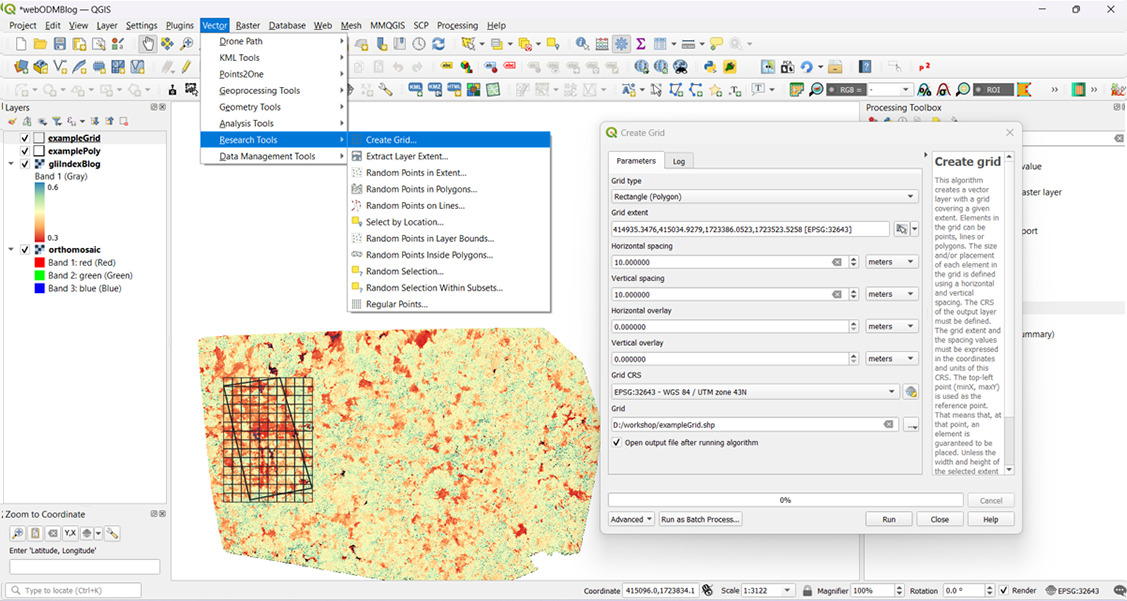
Fig 17: Creating a grid.

You can select the Rectangle type of grid, but there are other options like points, lines etc which can be chosen depending on the objective. Make sure to select the layer extent of the example polygon.

The above parameters should create a grid of rectangles of specified dimension.

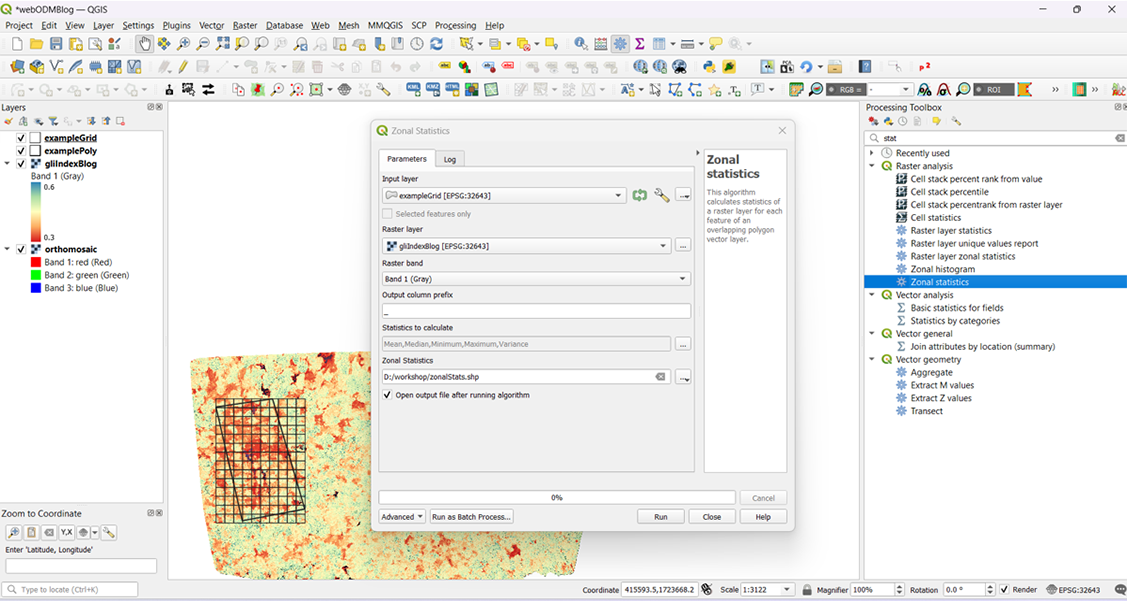
Fig. 18: Zonal statistics from Processing toolbox.

The zonal statistics can be selected from the ‘Processing toolbox’. One can select which statistics are to be calculated and a new polygon of zonal statistics will be created. 

Fig. 19: Select the statistics to be calculated.

Now one can choose the statistic which they want to display and select an appropriate symbology to assess the least to most leaf cover in the selected example area as shown in the figure below.

Fig. 20: Visualise the statistical output.

Creating a Mapping Mission

Unmanned Aerial Vehicles (UAVs) can create orthomosaics to better understand ecosystems. To plan the flight path of a UAV for orthomosaic creation, we’ve developed a plugin compatible with QGIS

UAV Mapping Path Generator (for Litchi)

Our UAV Mapping Path Generator plugin takes into account camera parameters, altitude, overlaps, and more to prepare an optimized flight plan. This flight plan is compatible with the FlyLitchi app, which operates flights for DJI drones.

The steps below describe the installation process, logic and method to use the plugin. To install the plugin:

  1. Go to Plugins > Manage and Install Plugins.

  2. Search for UAV Mapping Path Generator (for Litchi) and install it.

Fig. 01a: Install the plugin.

Fig. 01b: Install the plugin.

The plugin will be available for use from the ‘Vector’ menu.

Fig. 02: UAV Path Generator Plugin. 

SETTING UP THE PLUGIN

Some default drone camera specifications are pre-filled in the plugin. However, you can adjust these settings by accessing the drone specifications for your specific model here.

Mandatory Inputs for the Plugin:

  • Altitude

  • Field of View (FoV)

  • Side Overlap %

  • Front Overlap %

  • Aspect Ratio

  • Image Height & Width

  • Speed

  • Gimbal Pitch Angle

These drone camera parameters are readily available in the drone specifications. The overlap percentages you choose will influence both the area covered and the time taken for the drone to complete the flight. The plugin calculates and displays the approximate flight time at the end of its execution (see Fig. 05).

Note: The flight time shown in FLyLitchi is slightly longer than that calculated here.

The parameters and the input types are as described below.

Fig. 03

Fig. 04: Calculated parameters and formulae.

How to use the PlugIn:

Then the user has to upload a shapefile of the area of interest. This shapefile should be of polygon geometry type only and in EPSG:4326 GCS projection. The users are advised to select a polygon and fill this input in every execution and make sure to click on the ‘Load’ option after filling the input. Following the selection of AOI, the user must draw a line - ‘Input_line.shp’:

Notes on the line:

  • This line must be outside the AOI polygon.

  • It should be in a direction parallel to the desired drone path.

  • The drone path will be drawn to the right/above this line.

  • This line is plotted in EPSG:4326 GCS projection.

As soon as you click on the ‘Draw Line’ option, the toggle editing is enabled and the user will be prompted to draw a line in the required direction. To end this action, save the edit, untoggle the edit mode and then the plugin dialog box will pop back in the map interface and the draw line box will be populated.

Then the user should input an approximate number of parallel lines to the input line that would cover the entire area of interest. When the user clicks on the ‘Draw Flight Path’ option, the parallel lines are drawn and clipped to the area of interest and then the way points are created according to the overlap percentages as shown in Fig. 06.

The flight time is also calculated as soon as one clicks on the ‘Draw Flight Path’ is clicked. The Fig. 05 shows that the flight will take 60 minutes to finish the entire flight. Hence, the user must split the area to be covered in each flight as one drone battery gives 20 mins of effective flight time.

Fig. 05: Flight time calculated.

Example of input line and the drone path:

(a) Input horizontal line, (b) Drone path with horizontal input line at the bottom,

(c) Input vertical line; (d) Drone path with vertical input line on the left.

Fig. 06: Input for a drone-path.

Fig. 07: The flight path in FMH.

A Fly Litchi compatible csv file is then created and it can be opened in Fly Litchi Mission hub.  Make sure the waypoints in the csv file show on the map view.

From this point, one can use the FlyLitchi App to check settings and execute the mapping mission. For more instructions on using the fly litchi app, please refer to our other blog on planning photo and video missions for UAVs.

Below is a visual walk-through of using the above plugin.

Planning Photo and Video Missions for UAVs

When wanting to conduct a drone flight or mapping mission over a precise area of interest, one needs to plan the flight and path beforehand. This ensures that the entire area is covered completely and removes any visual errors or barriers that might occur during field work. Further, prefixing flight settings allows for more consistent data collection as compared to manual flights on the go.

We use a combination of two softwares for planning flights.The first among them is FlyLitchi Mission Hub (FMH) and the second is QGIS. The two can also be used in conjunction with one another. The process using both these softwares is described in this blog.

Using FlyLitchi:

FMH is a web app that enables us to plan drone flights from the desktop and later execute them using the android based Litchi app - Litchi for DJI drones which is available for a one time purchase in Google Play Store. 

The FlyLitchi mission hub interface has many flights that are publicly available for viewing on the desktop app as shown in Fig 1. We can also share our flight paths and drone videos to this application.

Fig. 01: FlyLitchi mission hub interface.

Login and Register: 

FMH is a free desktop application. One needs to register in order to create, upload and save the flight missions. To do this, click the ‘Log in’ button on the top right of the interface and create your account.

Set your area of interest:

a. Search for your Area Of Interest (AOI) in the search bar which is at the top left of the interface.

b. Click around the AOI to create way points to set the route of the mission.

Fig. 02: Way Point settings

c. Click around the AOI to create way points to set the route of the mission.

d. This mission can be stored by clicking on the MISSIONS option - bottom left and then clicking Save.

Way Point Settings:

I. Lat-Long: The location of the point is automatically logged as soon as you create a point.

II. Altitude (m): One needs to set the altitude of the drone above ground for all the points. In India, the legal limit as per the Directorate General of Civil Aviation (DGCA) is 120m. 

There is an ‘Above Current’ option under ‘Altitude settings’ available when you are batch editing the way point attributes. The “Above Current” option in FMH allows you to add a specific altitude to the current altitude of selected waypoints. It’s a convenient way to elevate all waypoints by a set distance without adjusting each one separately.

III. Speed (m/s): One can set the speed depending on the purpose of the mission. Max speed is 15m/s.

In a video mission like this, the speed can be set between 10m/s to 15m/s.

Pro tip: If you’re designing a mission to create an orthomosaic, keep the maximum speed below 8m/s to avoid distortion.

IV. Curve (m): If the curve is 0m then the drone will exactly fly to each point and then head to the next. If the purpose of the mission does not necessitate going to the exact location (esp. Turning Points) of the points, the drone will follow a curved path (blue line in Fig: 2) near the point (curve > 0m).

Fig. 03: Curve at the turns 

V. Heading: This is a circular (turn right - turn left) movement of the drone at a point location. It ranges from 0 to 360°. This controls which direction the drone is pointing. It is marked by a triangle-like marker on each way point. 

VI. POI: One can set one or multiple Points of Interest (POI) in FMH. The drone automatically points to the POI if set to do so. Here you can select which POI the drone should focus on if there are multiple POIs.

VII. Gimbal Pitch: This is like the angle defining the up-down movement of the camera. One can choose between 30 to -90°, where -90° points straight down. 

If you have chosen to Focus on a POI, then the drone automatically recalibrates its gimbal pitch to capture the POI throughout its mission. Alternatively, by picking the ‘Interpolate’ option, you can set a constant pitch angle which will be consistently maintained through the mission.

VIII. Intervals and actions: One can add some actions at each waypoint like Start/ Stop recording, Click a picture, Stay/ Hover etc. This option allows to set an action and the duration of the action if applicable.

Fig. 04: Way Point settings and Mission settings.

Mission settings: 

I. Units: One can choose the unit of measurement here.

II. Map Type: One can choose the base map upon which the flight missions appear. 

III. Heading Mode: The direction that the drone faces is set by this.

A. Auto: The drone faces the next way point.

B. Initial: The heading of the first way point is fixed for all.

C. Manual: Heading can be fixed during the flight. 

D. Custom: You can set the heading for each way point in FlyLitchi.

IV. Finish Action: At the end of the automated flight, the drone follows this action. 

A. RTH: Return to home - flies back to the drone launch point.

B. Land: It will land at the end of the mission.

C. Back to Start: The drone returns to the start of the mission.  

D. Reverse: It comes back the same path as the mission. 

V. Path Mode: The curve setting in way point settings is overridden by this path mode. If path mode is set to ‘Straight line’ then the flight path cannot have curved turns. If ‘Curved path’ is selected, one can set the curves at the points. 

VI. Cruising Speed and Max Flight Speed (m/s): The speed can be set here. 

VII. Default Curve Size (%): If path mode = ‘Curved turns’, then the new points that you add to the flight path will have the default curve size % that you specify. Default curve size will not work if the Path mode is set to ‘Straight Lines’.

VIII. Default Gimbal Pitch Mode: Same as way point settings but ‘MISSIONS’ settings override the way point settings.

Note: Mission settings override the way point settings.


Using QGIS to aid flight planning:

The boundary of the video mission can also be created in QGIS: This method is useful when the area of interest may not be obviously distinguishable in a satellite image. For example, if one owns a parcel of land, the boundaries need to be incorporated precisely and cannot be determined accurately through an image.

Here one has two options:

a. Load a boundary file of the AOI that you may already have.

b.  Create a shapefile layer from the Layer menu.

If you already have a shapefile for your area of interest-load it into QGIS and export it as a .kml file. This is because the FMH only processes .kmls and .csvs at present. The process for importing the .kml into FMH is described towards the end of the blog.

If you don’t already have a shapefile, you can create one using the following steps:

a. Go to Layer> create Layer and select New Shapefile Layer

Fig. 05: Creating a shapefile in QGIS.

b. Choose the name, source folder and projection to save your file.

Fig. 06: Creating a line shapefile.

c.  Now right click on the layer and select toggle editing. Then click on the Add line feature. You can now create a feature by digitising this boundary. 

Fig. 07: Digitising a line shapefile.

d. Export this line file to a .kml file. 

e. Import the .kml file to FMH using the ‘import’ option from the MISSIONS tab on the bottom left of the screen. 

Fig. 08: Import kml to FMH

f. Check and edit settings of each way point as mentioned in the previous section. 

Thus FlyLitchi and QGIS can be used to create video missions. The planned flights saved in FMH can then be executed using Litchi for DJI drones android app. The videos from the drone are recorded as .mp4 files.

The next step in our workflow would be processing these videos to sync them with telemetry data. More information on this process can be found on our blog on using Dashware.