How-to-?

Mapping port development in Karnataka

There are plans to build a set of ports along the coast of Karnataka, with potential impacts on both coastal communities and wildlife in the region. Independent journalist Supriya Vohra wrote a three-part story on this topic for Mongabay-India, and we prepared a set of maps to accompany these articles.

A visual representation of the 12 planned ports was unavailable; official government documents only contained details regarding the coordinates of the ports, and of the defined port limits.

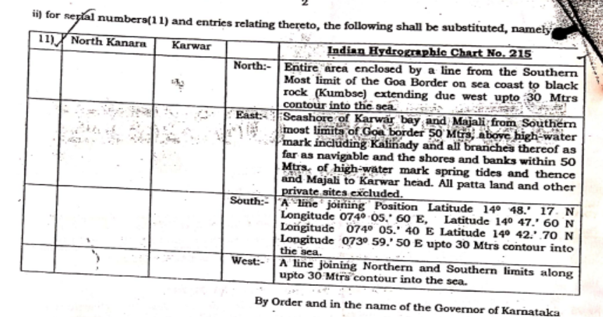
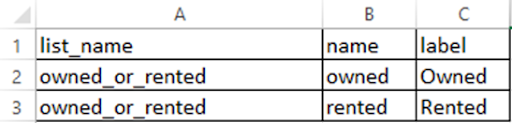
An example showing the port limit descriptions for port Karwar in the Government document.

Eastern, northern, and southern limits of minor ports limits as defined by the Government, along the coast of Karnataka. Port limits for Tadri and Pavinakurve were unavailable.

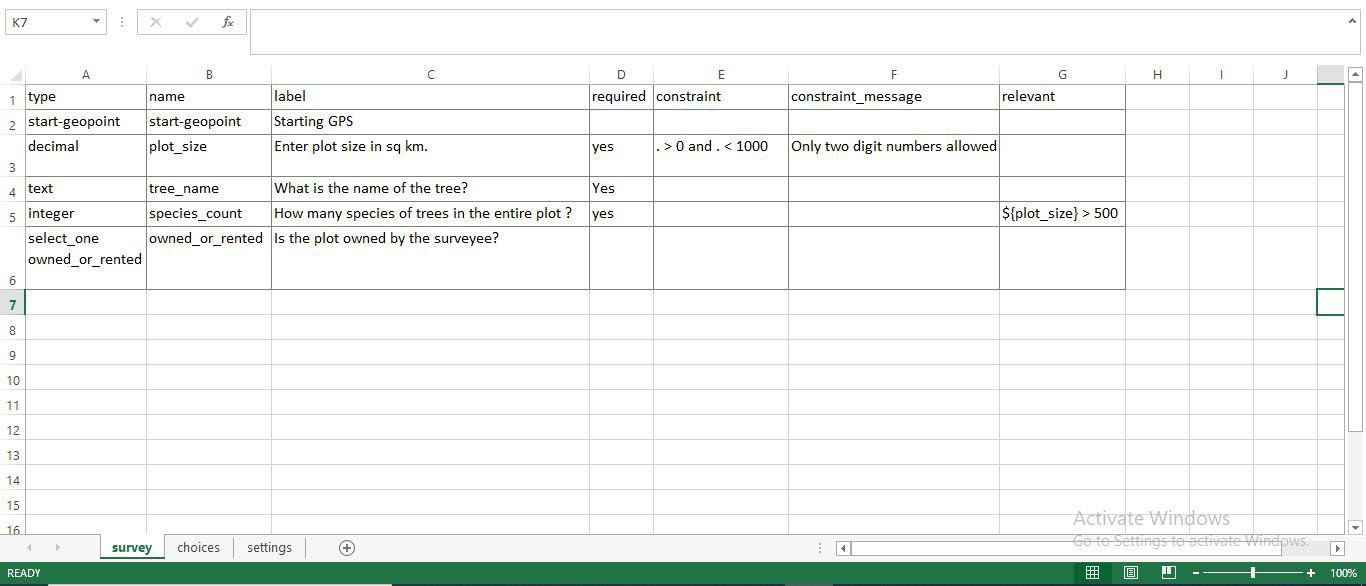
For the first story, our task was to map one major and twelve minor ports of Karnataka. Descriptions from the Indian Hydrographic Charts for each port in the official notifications were used to map the port boundaries. The descriptions of the port limits were such that following the details, one could locate the cardinal directions. While the instructions for the northern, southern, and western boundaries were mostly straightforward, the eastern borders were somewhat complex as they went inland. So, obtaining a complete understanding of the descriptions was the necessary first step in creating the maps.

The next step consisted of downloading bathymetry data. Bathymetric data are depth contours of the sea floor. For most of the ports, coordinates were available for north and south directions in the description to estimate limits that fell in or around the shores. Lines from these points extended towards the west into the sea to the 30 metre contour line that forms the northern and southern boundary. The western limit is the line joining the northern and southern limits along the 30 metre contour line in the sea. As required, I mapped only the northern, southern, and western limits for all the ports, using the coastline of India as the eastern border. I downloaded the bathymetry data from GEBCO (General Bathymetric Charts of the Oceans) in GeoTIFF format. The other options for downloading the dataset are in 2D netCDF and ESRI ASCII raster format. The reason I chose the GeoTIFF format is simply because it is a more commonly used format. After importing the data to ArcGIS Pro, I created contours to locate the port limits. 

Locating Port Honnavar’s northern and southern points in Google Earth Pro.

For each port, I followed the description in the notification. I used Google Earth to locate the coordinate points. I used Google to search for a few landmarks in the descriptions first, as they were unavailable via either Google Earth or labelled base maps in ArcGIS Pro. After confirming the locations, I then marked the northern and southern points as described in Google Earth Pro and exported them to ArcGIS Pro in a .KML file format. It was only done for the northern and southern points, mostly because only these directions had landmarks or coordinates in their description. The western border would be the 30 metre contour line connecting north-south. Once I created the contours and located the coordinates for each port, I finally started digitising the port limits by connecting those points in ArcGIS Pro. The coordinates of the few ports marked on the map were sourced from the official Karnataka Port website and exported after locating it on Google Earth.

Map on the road connecting the ongoing Honnavar port project.

The second story focused on the proposed port at Honnavar, where a road of around four kilometres long is being constructed. The entire stretch is the fish-drying ground of the coastal communities, and part of the proposed road also cuts through forest land. The port area includes confirmed nesting sites for the vulnerable Olive Ridley turtle, and there are also a few nests close to the road. 
We were provided with the turtle nesting sites data, originally collected by the Honnavar Forest Department, while the boundaries of the proposed Honnavar port and road were available in .kml format from PARIVESH. Making this map was relatively straightforward, as most of the data were already available, and it just had to be combined and represented.

Turtle nesting sites (2015-2022) as per Honnavar Forest Department records.

The third story lists the discrepancy between the turtle nesting sites as reported by the Honnavar Forest Department, and that presented to the public by the National Centre for Sustainable Coastal Management (NCSCM). In brief, the NCSCM actually indicates that the turtle nesting sites are in the Arabian Sea; Olive Ridley turtles, like all sea turtles, nest on land. Our analysis indicates that the NCSCM made a very basic conversion error when converting latitude-longitude pair values from one format to another, which was not identified before publication of their report.

Creating these maps was exciting as well as challenging; the most difficult part was to create port boundaries from only the written descriptions of directions, locations and depths. By visualising the issues surrounding these developments, we hope for the best possible ethical outcome for these ecologically sensitive areas, and the human and wildlife communities resident in them. 

Using PARIVESH for effective conservation advocacy

The following article authored by Pakhi Das, Shashank Srinivasan, Nancy Alice, Ashwathy Satheesan, Nandini Mehrotra and Anand Srinivasan was first published as ‘The PARIVESH Portal: Pros, Cons And How To Use’ by Sanctuary Asia on 03rd August, 2022.

Until July 15, 2014, the process for any development project to obtain a green clearance in India involved several stages - the circulation of physical project files between different officials at multiple stages of approval. File access was limited to the government, the applicants seeking green clearances, and the authorities granting approvals. Moreover, the complex nature of clearance processes and the lack of accountability created a lack of trust in the process.

To remedy this and to ensure better transparency and efficiency in the clearance process, the Ministry of Environment, Forest and Climate Change (MoEFCC) has established the PARIVESH website.

PARIVESH stands for Pro-Active Responsive facilitation by Interactive and Virtuous Environmental Single-window Hub. It is a web-based, workflow application that has digitised the entire process of submission and monitoring of Environment, Forest, Wildlife, and Coastal Regulation Zone (CRZ) Clearance proposals submitted by proponents to the Central, State, and District Level authorities. The portal allows project proponents to register themselves and submit applications for various green clearances in digital formats. Although seemingly designed for project proponents, PARIVESH has become a valuable resource of collated information that is open for viewing by the general public.

There are currently more than 10,000 land-use proposals submitted for clearance at the MoEFCC in India, ranging from the construction of multi-state national highways to the establishment of small-scale cottage industries. Various government officers and committees are assessing the potential impact of these proposed projects before granting approval.

The Benefits

The PARIVESH website hosts an enormous amount of information about all old and new projects seeking green clearances, organised by state, year, category and stage of approval. The information comprises spatial data regarding the outlines of the project site location and alignment, the area of forest land being diverted, site inspection, and biodiversity assessment reports. Such information is of immense value for conservation and is freely available on the portal.

Using the appropriate search functions, project information concerning any given project is available for viewing or, in some cases, even downloading. The portal also hosts details of discussions of various expert committees through the agenda and meeting minutes, allowing people from outside the system to view and analyse the processes that ultimately affect India’s wildlife and environment. All the relevant information is presented as an application package with downloadable file attachments, which could prove beneficial for conservation research and advocacy. The quantity and variety of information on the portal make it a treasure trove for anyone and everyone interested in the green clearance space of India.

Information that can be found on the PARIVESH website about any development project in India:

1. Area sought for clearance
2. Project cost
3. Spatial information about project location in KML (Keyhole Markup Language) format, details of the land required for clearance such as forest division names, area of forest and non-forest land, village and district wise breakup of the total proposed land, etc.
4. Details of Project Proponent/User Agency
5. Cost Benefit Analysis undertaken
6. Status/links to associated environmental or wildlife clearance (if any)
7. Project plan/ feasibility reports/ site inspection reports

Non-user Friendly Interface

While introducing PARIVESH for digitising the green clearance process in India helps to bring about transparency and accountability in the system, the portal is not user-friendly and is cumbersome to navigate.

The system should be able to streamline important projects and allow easy access to relevant information however, most of the files are not appropriately tagged, making the search options unreliable. To be able to ‘find’ specific projects within a timeframe, the user must know specific project details such as the exact name of the project, project file number, and the clearance level.

Additionally, green clearances are complex processes and involve multiple levels of reviews and recommendations from various government departments. These processes are broadly divided into three clearance verticals, namely Environmental Clearance, Forests Clearance, and Wildlife Clearance. Each of these verticals has its own set of processes and organisation hierarchies that the project file must circulate through at the level of first the state and then the centre. In the instance that a user is able to trace the details of a particular project on the platform, comprehending what stage of approval that project could be at and what that stage of approval entails is a task in itself.

Problems with the PARIVESH website

1. Low Discoverability: Navigating through the PARIVESH portal is complicated as information is not organised uniformly across types/categories and sometimes even regarding regions.
2. Decision Fatigue: Because of the structure of the portal, too many steps are involved in obtaining a particular project’s information
3. Inappropriate Project Tagging: Proposals, projects or additional attached documents are not appropriately tagged, which makes finding them using the search function cumbersome.
4. Complexities of the Clearance Processes: The complexities of the clearance processes and organisational hierarchies make access to information additionally difficult. The portal does not describe the various stages of approval under different clearances.

How Can This Be Improved?

For effective conservation advocacy, knowledge of potential areas of intervention is crucial, which makes a clear understanding of what happens at each level of approval imperative.

Simple features, such as an option to view projects cumulatively across the clearance types, or to view projects on a spatial platform, would increase the efficiency of the portal manifold. The dashboards for different types/verticals of clearances use abbreviations for the stages of approval with no description of what those abbreviations stand for nor what each of those stages entails, thus creating a limitation in the understanding of the clearance procedures altogether. Furthermore, there is a lack of features that would allow users interested in specific projects to subscribe or receive notifications for any updates on the approvals.

PARIVESH, although perhaps designed for project proponents seeking clearances, has been a useful portal for other stakeholders. The inclusion of features such as these would revolutionise accessing vast amounts of publicly available data for all stakeholders and will allow them to be more involved.

To truly achieve the goal of increased transparency and efficiency in the green clearance process in India, providing better access to information is key. India has a growing population of aware citizens from an array of backgrounds and a better system would greatly empower them to play an active role in determining the future of the environment, forests, and wildlife of the country.

Flowchart illustrating an user agency’s process in PARIVESH.

How to Use PARIVESH: A step-by-step guide with tips

PARIVESH hosts a large volume of project information, which is of immense use for awareness, campaigning or advocacy. However, navigating the portal to get to relevant information often involves many steps. It is important to narrow down search to the farthest extent possible by applying relevant filters. One might also have to scan through multiple project forms and verify information from other media articles and web reports. However, if a project is cleared, it is mandatory for it to have gone through PARIVESH, and information about it must be available on the portal. Here's how to access this information.

Step 1: Make a list of all the known information about the project one is seeking information on

For example, let us do so for the Etalin Hydropower Project.

Critical known information about Etalin hydropower project
- State name: Arunachal Pradesh
- Area: Dibang Valley
- Project Proponent: Jindal Power Ltd.
- Category of Project: Hydroelectric/hydel
- Date proposed: Before 2016 (although not crucial, it is often helpful to review other existing information/media reports about the project of interest. Information such as the timeline of the project helps in narrowing down search)

Step 2: Explore PARIVESH Portal

Note: All projects proposed on PARIVESH are organised according to the type of clearance sought into three categories -- environment, forest and wildlife clearance.

To find information, each of these types can be explored independently. The following sections provide a step by step guide to navigating the portal.


For Forest Clearance
1. Open https://parivesh.nic.in/ homepage, scroll down and select ‘Forest Clearance’.

2. To view all forest clearance projects, select ‘Dashboard’ option on the header.

3. Once clicked dashboard, apply filters to narrow down search filters such as state, category and hit search.


Note: Projects under forest clearance on PARIVESH are organised in two categories - Stage I and Stage II. If the status of clearance of the project is known, lead search by that status. However, if this information is not known, explore both stages.

4. To view all Stage 1 projects, click on the ‘Form A part II, Under Stage I’ button on the dashboard. As seen below, there are a total of 12 hydel projects proposed in Arunachal Pradesh, which are currently under stage 1.

5. Click on ‘ACCEPTED’ (these are all the relevant projects according to the applied filters).

6. A dataset of all projects as per the chosen category will be displayed with unique project IDs, and other relevant information, which should allow one to review and identify the project of interest.

Things to note while trying to identify project of interest:
(i) Is the project proponent the same as known information? Eg. Jindal Power Ltd.
(ii) Is the forest division/area the same as known information? Eg. Dibang Valley.
(iii) Is the project proposed in the known timeline? Eg. 2015.

(Screen grab of all hydel projects in Arunachal as on May 5, 2022)

7. Each project has a corresponding form, which hosts information about the project.
To view this information and to recognise project of interest, click on magnifying glass icon under column titled ‘View Report on Allocation of Fresh Forest Land (Form-A) Part-I’

8. The Form A part I includes information such as the forest division details, area for clearance, spatial data, additional documents, etc. all in downloadable formats.

9. All the documents and the form itself can be downloaded as PDFs. It is important to note that until the project is granted final clearance, the proponents can make edits, add or delete files on the portal.

Note: The precedent blogpost on decoding and navigating PARIVESH can be read here.

Using Open Data Kit (ODK) in the field

When in the field conducting environmental or ecological surveys, a record of events and subjects is often collected for future reporting and analysis. This has traditionally been a physical record, collected using pen and paper. In recent years, physical records are being digitised, and the process of data collection itself is now often digital. Digital records of events and observations in the field can now be collected using forms on mobile phones, even when the devices are offline.

OpenDataKit (ODK) is a suite of open source tools that aids in the collection and storage of survey data, including audio, video and imagery among others. The form can be customised as necessary; for example, it can have mandatory questions, allow only specific inputs as responses and loop question threads. These features help reduce the inherent error in collecting data in the field. In this blog post, I will explain the customisation features and provide the steps to build a basic form in ODK.

ODK Flow Illustration

Getting started

There are two ways to create customised survey forms for ODK.

  1. Using ODK Build.

  2. Using XLS Form.

ODK Build is a browser-based tool that allows users to drag and drop blocks together to create forms. While it is a great way to begin using ODK, it is not as powerful or customisable as using the XLSForm method.

To use XLSForm, one needs access to the XLSForm software itself, which is free and open-source (Online version here and offline version here). Essentially, the user creates a form using spreadsheet software that outputs the .xls format, which can be accomplished with both MS Excel as well as with Google Sheets. This form is then processed through the XLSForm software, to create the mobile-friendly survey file (in .xml format). The form itself has to comply with a set format and syntax; for example, ‘type’, ‘name’ and ‘label’ are mandatory columns that must exist for the spreadsheet to be successfully converted into a form, while other columns are optional. 

The basic format required is detailed in the XLSForm documentation (XLS Form document). In addition, I found this sheet called widgets quite helpful, as it provides an exhaustive list of options to populate the ‘type’ column.

Mock form using XLSForm

In this section, I’m sharing the steps of building a simple ODK form using XLS form. I’m assuming there’s a plot of trees owned by the surveyees. Now, say one wants to conduct a survey, to collect data of individual trees in the plot and data about the plot. I’ve listed a few probable questions which serve as good examples to build a customised form.

  1. Open a new workbook/spreadsheet. Name the first three columns as ‘type’, ‘name’ and ‘label’. Name the worksheet as ‘survey’. All the column and worksheet names are case sensitive. The following question uses a ‘start-geopoint’ widget. This forces the android phone to start location service.

2. Using two more columns: ‘constraint’, ‘constraint_message’.

3. Add another column named ‘required’. Required indicates that it is a mandatory field/question. This question uses a text widget as shown under the type column.

4. Ask the following question only if the plot size is > 500 sq km and for that add another column ‘relevant’.

The above question is asked only if the plot size (previous question) is more than 500 - a conditional question. There are many ways of asking such questions. For example, one can repeat a set of questions based on certain conditions and other such. This is a type of dynamic form as questions change based on conditions.

5. Ask if the plot is owned or rented - a yes or no question - this is to give an example of using ‘choices’ worksheet. Leave the other columns (constraint,relevant, etc.) blank when not required.

Create the choices worksheet as shown in the form definition template. Enter the following in the ‘choices’ worksheet. 

Also take note of the ‘settings’ worksheet Fig3 - the ‘version’ column of this worksheet must be different for every draft of form for it to reflect the changes in the ODK Collect App.

Fig. 01 Survey Worksheet

Fig. 02 Choices Worksheet

Fig. 03 Settings Worksheet

Mock form using ODK Build:

The easier way of building forms is by using ODK Build. Forms can be build by dragging and dropping appropriate widgets. One example is given below:

Fig. 04 ODK Build Mock Form

Use ‘Add New’ at the bottom left of the screen to add new rows of widgets. This toolbar contains the different types of widgets and is similar to populating the ‘type’ column of XLS Form. The properties of the widget can be described at the Property Dialogue box of each widget which opens to the right of the screen. Data name is similar to the ‘name’ column in XLS Form. Other conditions and columns like relevant, required, constraint etc can be added using the Property Dialogue Box. An example is shown above in Fig4. After the form is built, one can export the form to XLS Form or XML Form using the File menu as shown below in Fig5.

Fig. 05 ODK Build - File Menu

Although syntax dependent, I found the XLS Form method to be more robust in terms of building the form and rectifying the errors. The XML form obtained through ODK Build is not necessarily error free. If you are using the XML Form from ODK Build without going through the Form Validation step described below, there is a possibility that the form will have errors in the ODK Collect App or while collecting the data. Hence, it is advisable to download the XLS Form from the ODK Build and follow the steps below to validate the form and then input it to the ODK Collect Mobile application.

Form Validation:

After the completion of the form, go to ODK Online and choose your .xlsx format form for submission. If you have built the form in google sheets, you must download it in .xlsx format and run it through the validation. Any errors in the form are displayed here after clicking on submit. Rectify the errors and submit again until ‘Preview in Browser’ and ‘Download XForm’ options appear as shown in Fig6. A point to note here is that the form is debugged line by line in ODK Online. Hence, each time an error pops up it must be rectified and submitted again. All the errors are not shown at once so it would be a good idea to make the .xlsx format as default for the form as mentioned earlier. Check the preview and validate the form. Then, click on ‘Download XForm’ and the XML file of the form will be downloaded. 

Fig. 06 Form validation

Connecting to Google Drive:

Once the form is ready to be used for data collection, we need to connect it to the ODK Collect Mobile App. For that, go to your google drive and create a folder for ODK forms. Upload the previously downloaded xml form in it. Then create an empty google sheet in which the responses of the survey will be collected. 

ODK Collect Mobile App set up:

Download and install ODK Collect from Google Play Store. Please note that, ODK Collect App is only Android compatible. 

Fig. 07 Server settings

  1. As soon as you open the app after installation, the server settings must be configured as shown in Fig7 after selecting ‘Manually enter project details’.

  2. Type - must be selected as Google Drive, Google Sheets if it's not set by default.

  3. Google account - Enter the google account of the google drive which will be used to collect and store survey data.

  4. Fallback submission URL - share the URL of the empty google sheet which was created in the google drive in the above step. This step ensures that all the collected data is sent to the mentioned submission URL.

  5. If using ODK Build, then one can set the submission URL in the Edit menu → Form Properties as shown in Fig8. 

  6. One can also use the QR code method to configure the settings 8

Fig. 08 Form Properties - ODK Build

Survey from Mobile:

Once the settings are configured, it is time to get the form and collect data. For that, 

Fig. 09 Main menu

Fig. 10 Select xml.

Fig. 11 Fill Blank Form

  1. Select ‘Get Blank Form’ from the Main menu in Fig9.

  2. Under that select the ODK folder created in the previous step - Select the xml form and click on ‘Download selected’.

  3. When you receive the ‘download successful’ message, go back to the main menu in the form and now select ‘Fill Blank Form’ from the Main Menu. Once the form is filled, go to ‘Send Finalised Form’ in the main menu and click on Send, alternatively you can also automate the sending of forms under - Account - Project Settings - Form management - Form submission Options.

  4. Go to your empty google sheet in the ODK folder and check how the responses have been recorded. Take note of the column names - these are the names entered in the ‘name’ column in your ‘survey’ worksheet. Tweak the survey form (column names, relevant questions etc) in accordance with the response sheet so that post survey analysis is free of confusion. Exploit the ‘calculation’, ‘appearance’, ‘hint’ and other columns which will make the survey precise.

Other essentials on ODK:

The official use cases and examples of all widgets are provided here. If you want to design a basic form using drag and drop functionality - ODK build is the way to go. However, this is not as customizable as the XLSForm method. Read more on ODK Central for setting up ODK on a larger scale.