This will be a relatively short post; I’ve been working with Landsat data for a few years now, and I find it absolutely fascinating. The new Landsat satellite, initially named the Landsat Data Continuity Mission and now known as Landsat 8, is actually the 7th in the series; Landsat 6 never made it to orbit. When Landsat 8 was launched on the 11th of February 2013, I was really anxious and excited and when it made it to orbit successfully, I was ecstatic. I downloaded my first set of Landsat data (Path146/Row040, covering the Indian city of Delhi) off the USGS EarthExplorer website last week, and have been tinkering with it ever since.

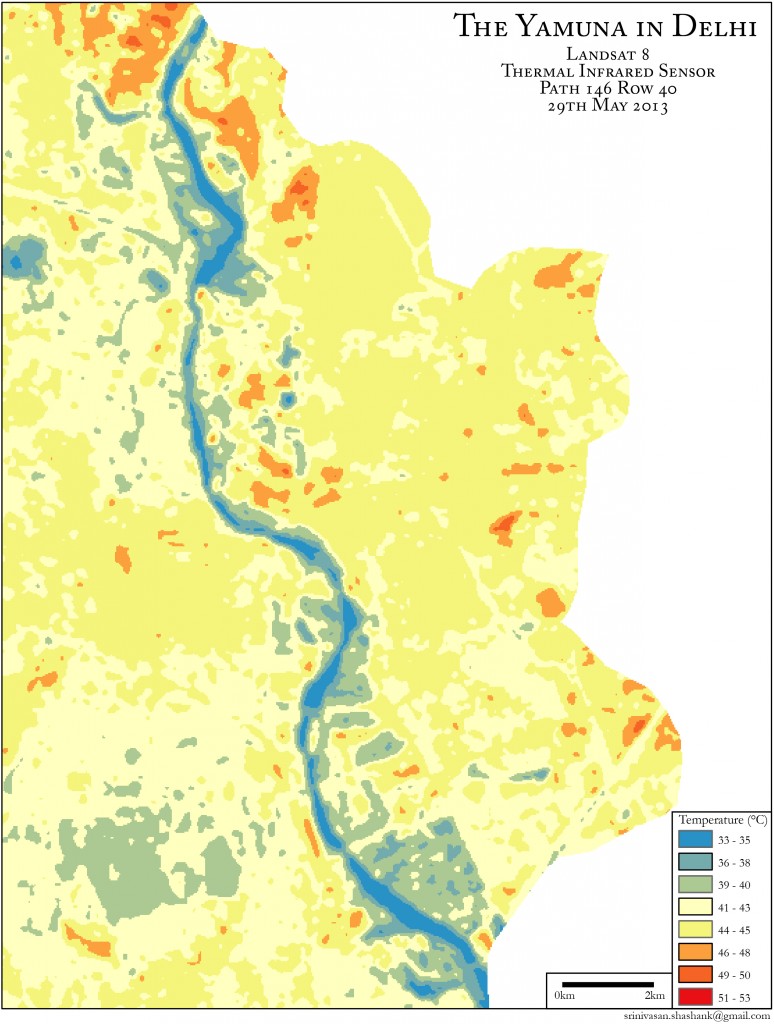
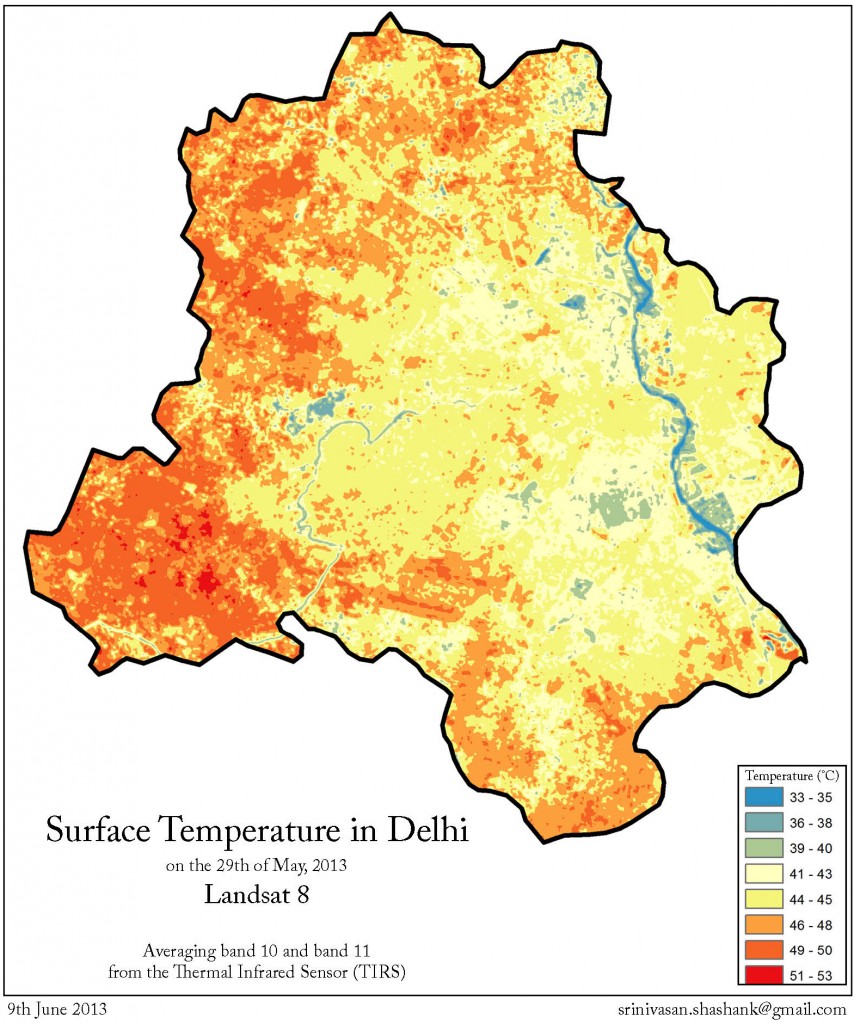
The map above depicts various band-combinations; each band covers a discrete section of the electromagnetic spectrum. While bands 2, 3 and 4 lie within the visible spectrum and correspond to the colours blue, green and red, the others extend into the non-visible electromagnetic spectrum. A variety of mathematical operations can be conducted using different band combinations to obtain meaningful information about the Earth’s surface. For example, the following maps depict the surface temperature in Delhi, with a close-up of the Yamuna, on the 29th of May. A longer post on Landsat 8, its instrumentation and the various use-cases will follow once I’ve had my fill of playing with this data.